|
| template<typename Y > |
| void | AddHistGraph (openfpm::vector< Y > &y) |
| | Add an histogram graph. More...
|
| |
| template<typename X , typename Y > |
| void | AddHistGraph (openfpm::vector< X > &x, openfpm::vector< Y > &y) |
| | Add an histogram graph. More...
|
| |
| template<typename X , typename Y , typename Yn > |
| void | AddHistGraph (openfpm::vector< X > &x, openfpm::vector< Y > &y, openfpm::vector< Yn > &yn) |
| | Add an histogram graph. More...
|
| |
| template<typename X , typename Y , typename Yn > |
| void | AddHistGraph (openfpm::vector< X > &x, openfpm::vector< Y > &y, openfpm::vector< Yn > &yn, const GCoptions &opt) |
| | Add an histogram graph. More...
|
| |
| template<typename X , typename Y > |
| void | AddLinesGraph (openfpm::vector< X > &x, openfpm::vector< Y > &y, const GCoptions &opt) |
| | Add a simple lines graph. More...
|
| |
| template<typename X , typename Y > |
| void | AddLinesGraph (openfpm::vector< X > &x, openfpm::vector< Y > &y, const openfpm::vector< std::string > &yn, const GCoptions &opt) |
| | Add a simple plot graph. More...
|
| |
| void | addHTML (const std::string &html) |
| | Add HTML text. More...
|
| |
| void | write (std::string file) |
| | It write the graphs on file in html format using Google charts. More...
|
| |
Small class to produce graph with Google chart in HTML.
This Class can produce several graph using google chart
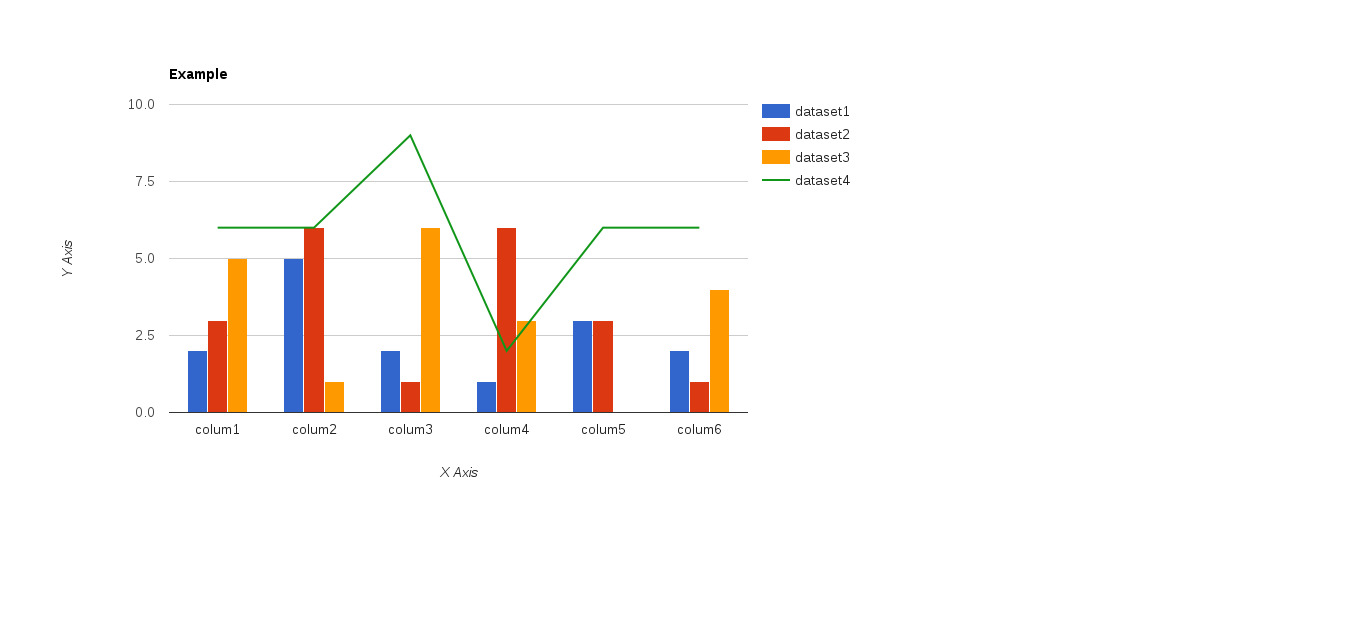
Create Histogram graph
This code produce the graph above
openfpm::vector<std::string> x;
openfpm::vector<openfpm::vector<size_t>> y;
openfpm::vector<std::string> yn;
x.add("colum1");
x.add("colum2");
x.add("colum3");
x.add("colum4");
x.add("colum5");
x.add("colum6");
yn.add("dataset1");
yn.add("dataset2");
yn.add("dataset3");
yn.add("dataset4");
y.add({2,3,5,6});
y.add({5,6,1,6});
y.add({2,1,6,9});
y.add({1,6,3,2});
y.add({3,3,0,6});
y.add({2,1,4,6});
options.
title = std::string(
"Example");
options.
yAxis = std::string(
"Y Axis");
options.
xAxis = std::string(
"X Axis");
options.
stype = std::string(
"bars");
options.
stypeext = std::string(
"{3: {type: 'line'}}");
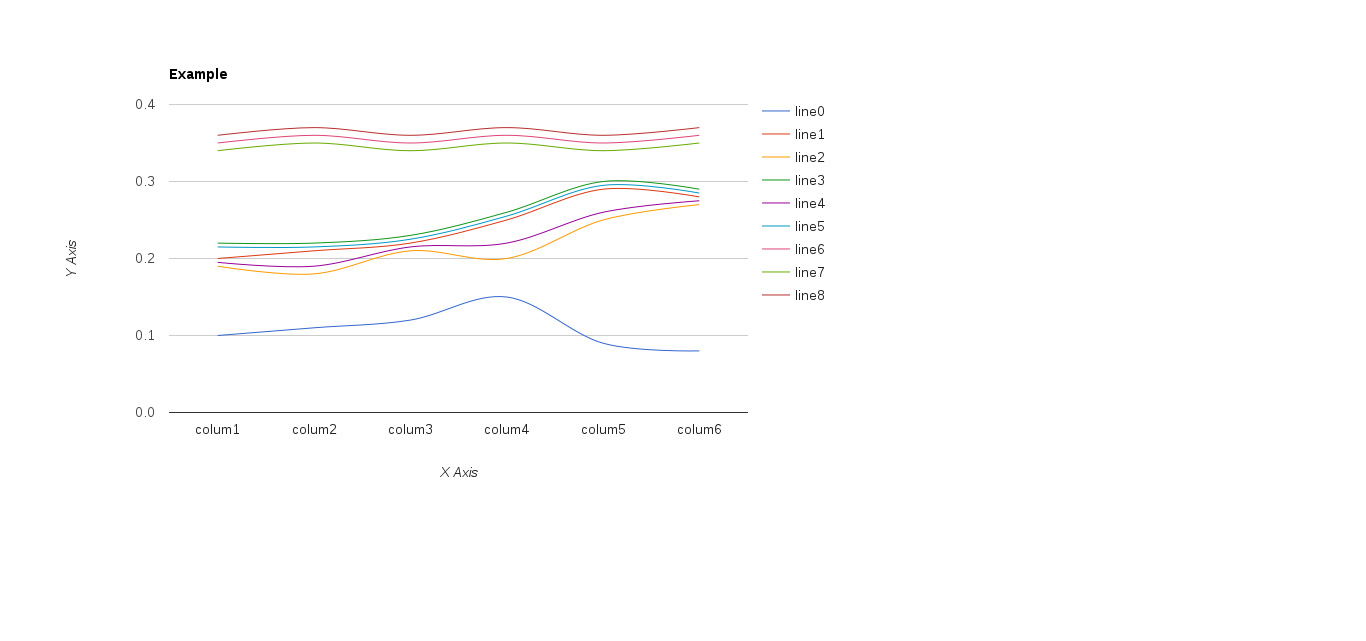
Create Lines
This code produce the graph above
openfpm::vector<std::string> x;
openfpm::vector<openfpm::vector<double>> y;
x.add("colum1");
x.add("colum2");
x.add("colum3");
x.add("colum4");
x.add("colum5");
x.add("colum6");
y.add({0.10,0.20,0.19,0.22,0.195,0.215,0.35,0.34,0.36});
y.add({0.11,0.21,0.18,0.22,0.19,0.215,0.36,0.35,0.37});
y.add({0.12,0.22,0.21,0.23,0.215,0.225,0.35,0.34,0.36});
y.add({0.15,0.25,0.20,0.26,0.22,0.255,0.36,0.35,0.37});
y.add({0.09,0.29,0.25,0.30,0.26,0.295,0.35,0.34,0.36});
y.add({0.08,0.28,0.27,0.29,0.275,0.285,0.36,0.35,0.37});
options.
title = std::string(
"Example");
options.
yAxis = std::string(
"Y Axis");
options.
xAxis = std::string(
"X Axis");
cg.
write(
"gc_plot2_out.html");
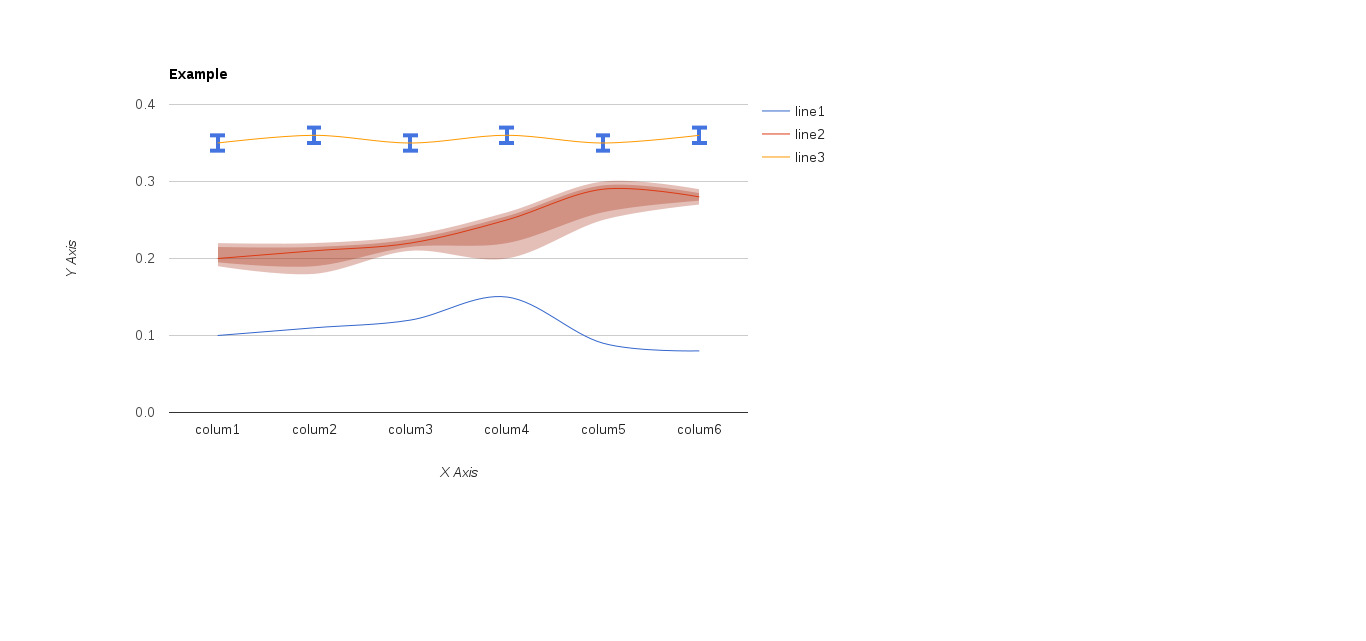
Create lines with different styles
This code produce the graph above
openfpm::vector<std::string> x;
openfpm::vector<openfpm::vector<double>> y;
openfpm::vector<std::string> yn;
x.add("colum1");
x.add("colum2");
x.add("colum3");
x.add("colum4");
x.add("colum5");
x.add("colum6");
yn.add("line1");
yn.add("line2");
yn.add("interval");
yn.add("interval");
yn.add("interval");
yn.add("interval");
yn.add("line3");
yn.add("interval");
yn.add("interval");
y.add({0.10,0.20,0.19,0.22,0.195,0.215,0.35,0.34,0.36});
y.add({0.11,0.21,0.18,0.22,0.19,0.215,0.36,0.35,0.37});
y.add({0.12,0.22,0.21,0.23,0.215,0.225,0.35,0.34,0.36});
y.add({0.15,0.25,0.20,0.26,0.22,0.255,0.36,0.35,0.37});
y.add({0.09,0.29,0.25,0.30,0.26,0.295,0.35,0.34,0.36});
y.add({0.08,0.28,0.27,0.29,0.275,0.285,0.36,0.35,0.37});
options.
title = std::string(
"Example");
options.
yAxis = std::string(
"Y Axis");
options.
xAxis = std::string(
"X Axis");
options.
intervalext = std::string(
"{'i2': { 'color': '#4374E0', 'style':'bars', 'lineWidth':4, 'fillOpacity':1 } }");
cg.
write(
"gc_plot_out.html");
Definition at line 146 of file GoogleChart.hpp.


 1.8.6
1.8.6